AI infographic generator
AI infographics that actually read
Describe the data, the labels, and the layout — and get a clean infographic with legible text and a hierarchy that holds together. No design software, no subscription.
No subscription. Top up from $5. Pay only for what you generate.
Recommended model
Seedream 5 Pro
BytePlus Seedream 5 Pro is the layout-and-text specialist — it runs a reasoning pass over your brief before it draws, so information-dense visuals come out organised, with legible text in over a dozen languages and a hierarchy you can actually follow. It's the pick when the words on the image matter as much as the picture.
How it works
Step 1
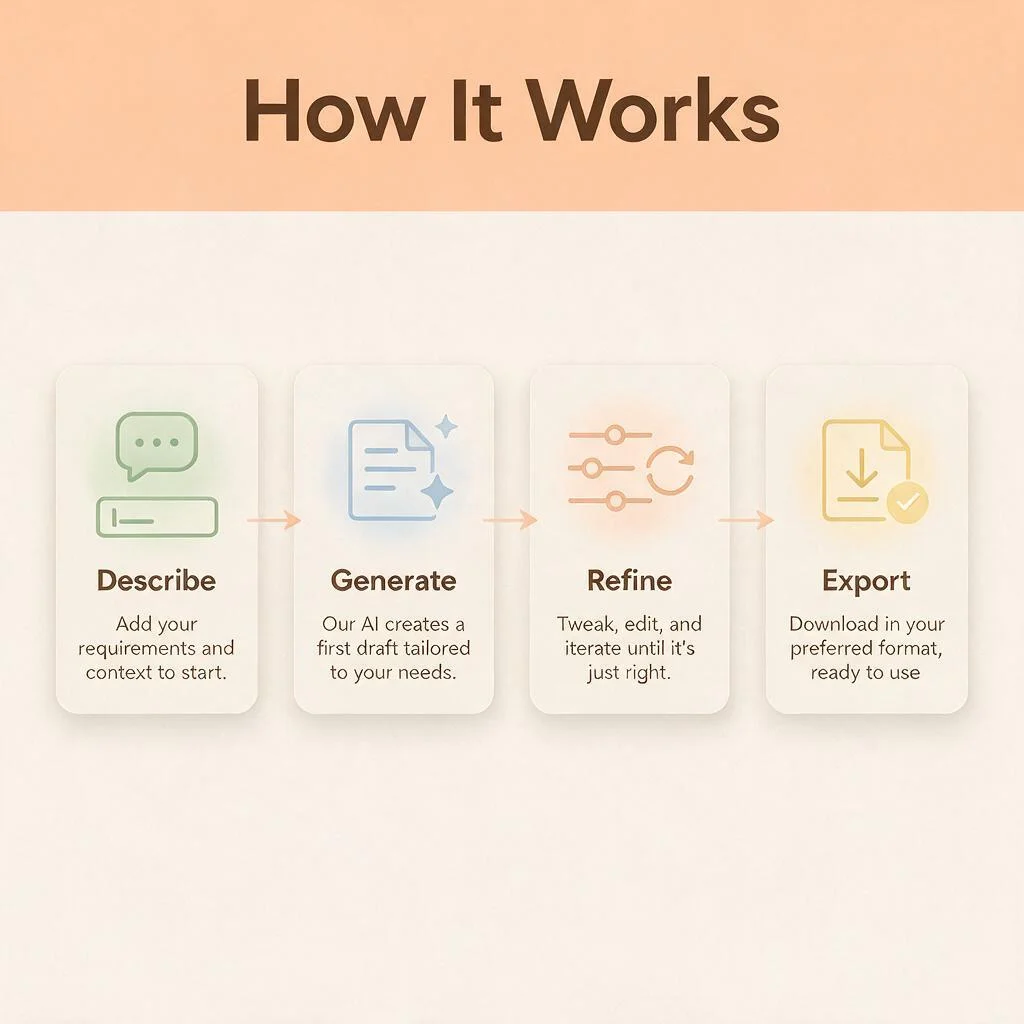
Describe the content and layout
Say what the infographic is about, list the labels, and sketch the arrangement in words — "a bold title band across the top, four stages in a row beneath it, arrows between them." Pro plans the layout before it draws.
Step 2
Quote the text you want rendered
Put every heading and label in double quotes so Pro knows what's text and what's description — "Evaporation", "Condensation". Keep phrases short, and name the typeface style for a cleaner result.
Step 3
Generate and refine
Every prompt lives in a thread. Click the result to feed it into the next prompt — recolour a band, swap a label, add a badge — and Pro edits that region while holding the rest of the layout steady.
Step 4
Download — yours to use
Every image you generate is yours, commercial work included. Slide decks, reports, social posts, print. No attribution required, no extra licensing.
Example prompts
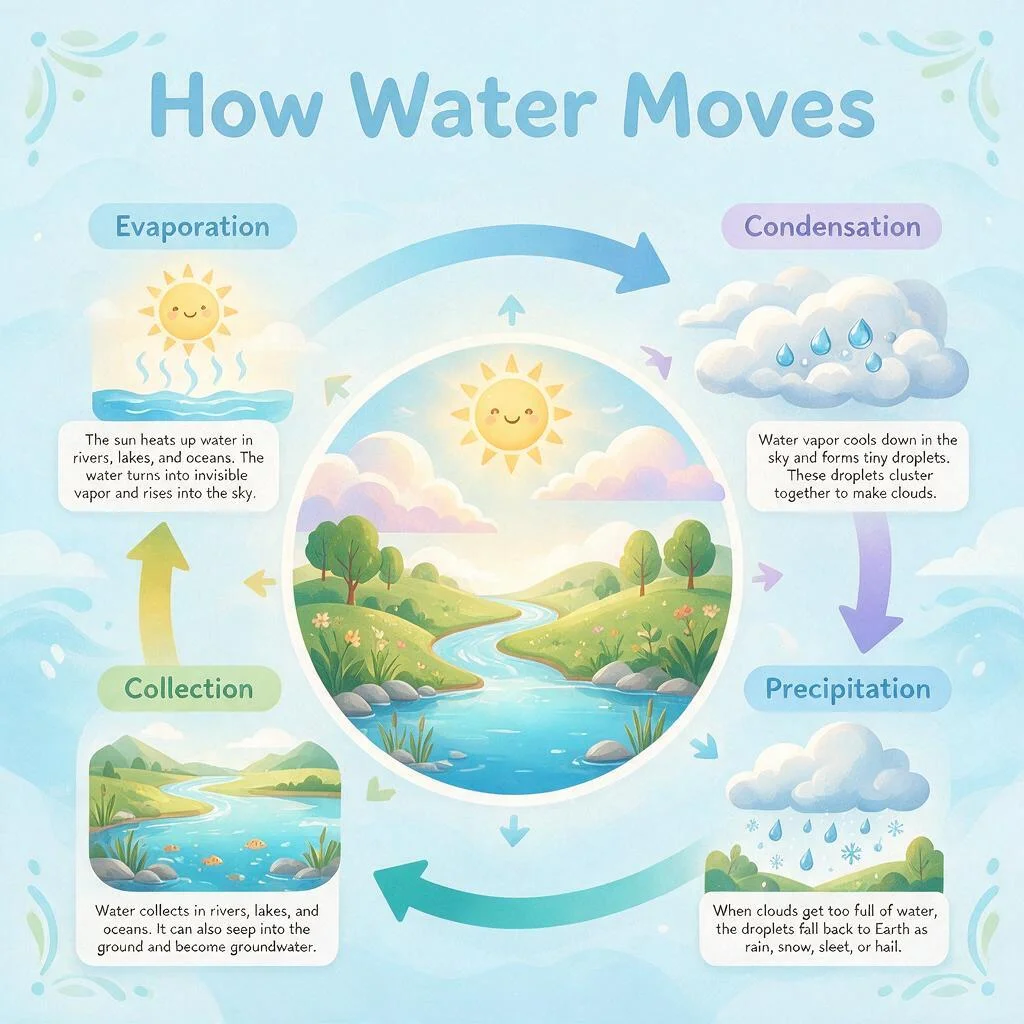
A clean modern infographic titled "How Water Moves" — four labelled stages ("Evaporation", "Condensation", "Precipitation", "Collection") arranged around a central illustration with directional arrows, warm pastel palette, friendly geometric icons.
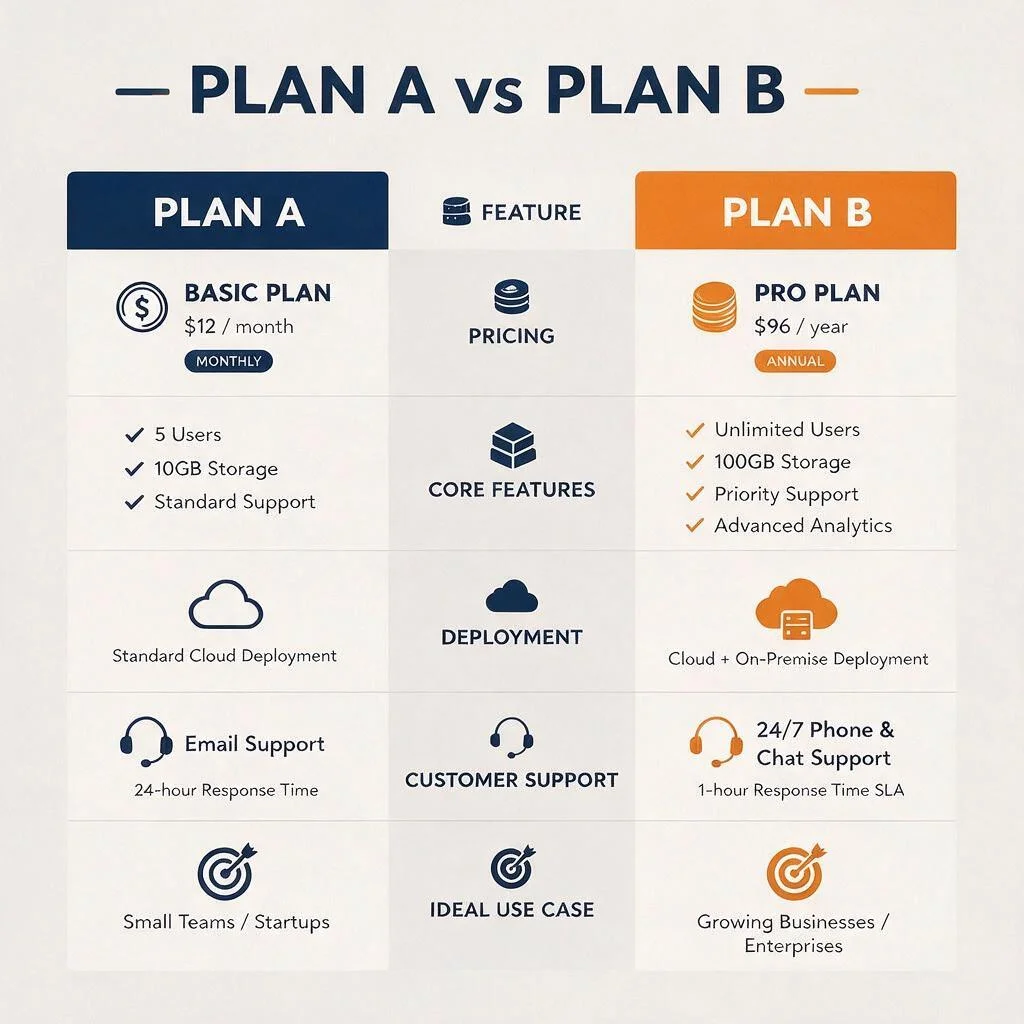
A side-by-side comparison chart titled "Plan A vs Plan B", two columns with a bold header row and five labelled feature rows beneath, flat two-colour palette, generous negative space, geometric sans-serif labels.
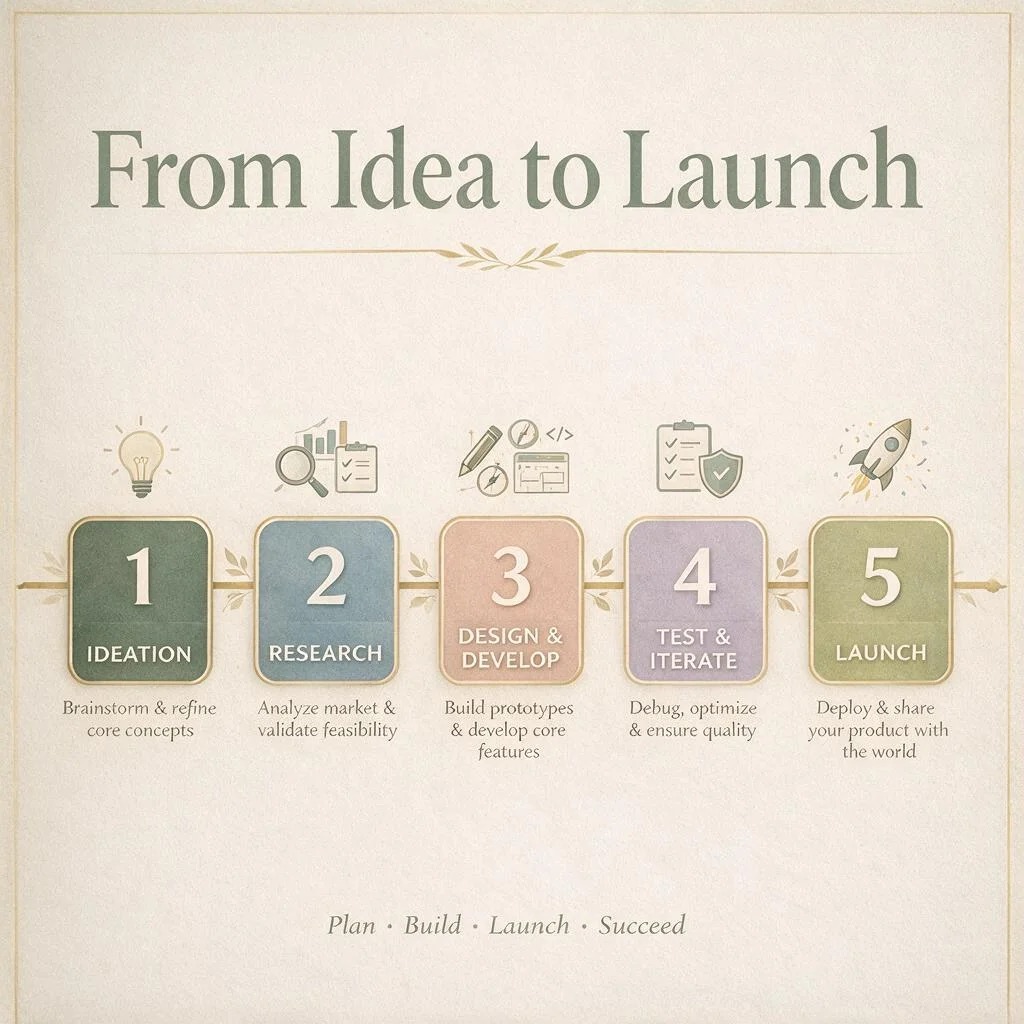
A process timeline poster titled "From Idea to Launch", five numbered steps along a horizontal track with a short caption under each, a small icon per step, muted editorial palette, clear typographic hierarchy.
Frequently asked questions
Yes — that's the point of using Seedream 5 Pro. Put each heading and label in double quotes in your prompt and keep phrases short. Legible text and layout hierarchy are its headline strengths, so titles, labels, and captions come out readable rather than as garbled shapes.
Yes. Pro renders native text across roughly fourteen languages — including Arabic, Japanese, and Korean — inside a single image. Name the language for each block of text if the script could be ambiguous, and quote the exact words.
Yes. Click any past generation to feed it into your next prompt, then name the change and what to keep — "change the headline to 'Autumn Menu' in the same typeface and position, leave everything else." Pro is built for precise, region-level edits rather than re-rolling the whole image.
It's pay-as-you-go. Top up from $5 at 100 credits per dollar, and pick the 1K or 2K tier per generation — 1K for quick drafts, 2K for finished, detail-rich work. New accounts also get free trial credits.
Yes on both. Everything you generate is yours to use however you'd like, including commercial work, with no attribution required. Your prompts, uploads, and generations are private to your account and are never used to train AI models.
More ways to use Maejik
Ready to create something amazing?
Start with 40 free credits. No credit card required.
Get started free